
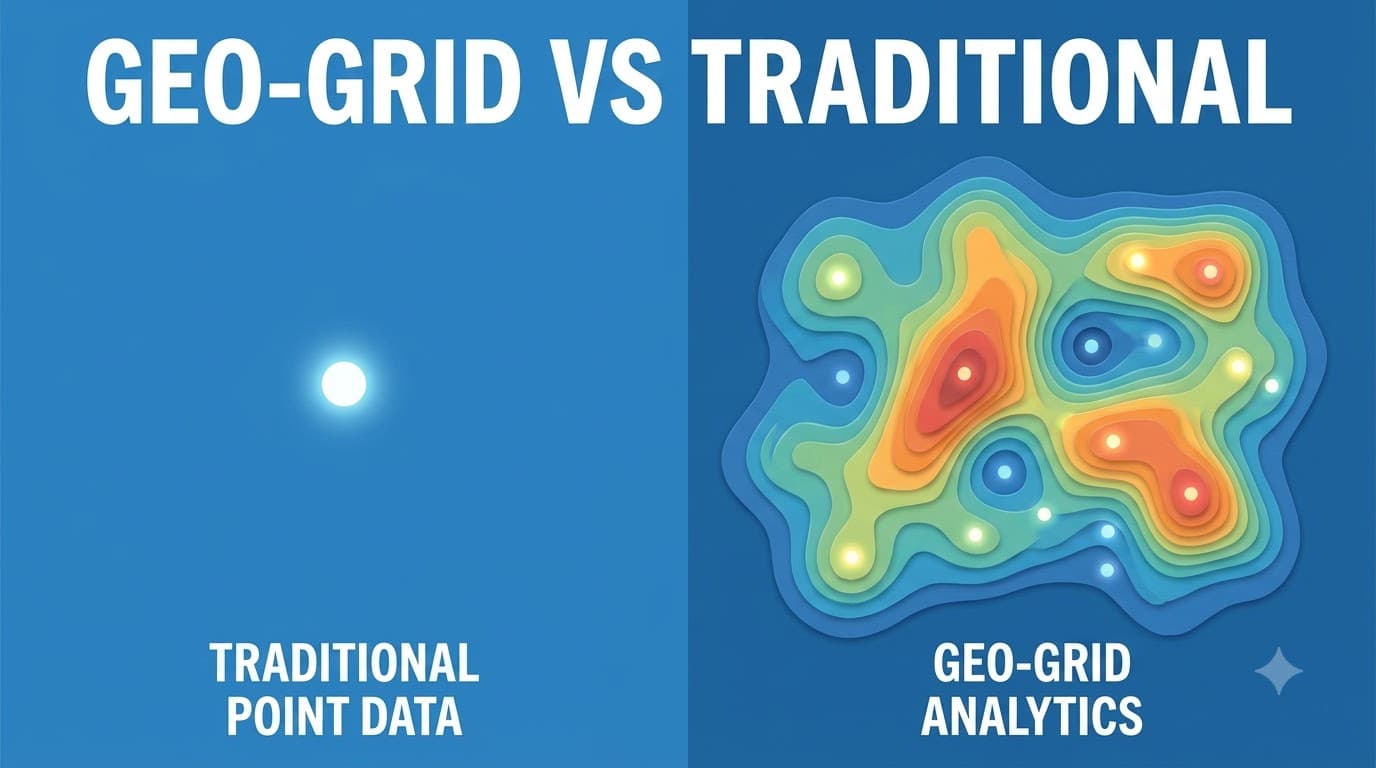
Geo-Grid Heatmaps vs Traditional Rank Trackers: What You're Missing
Traditional rank trackers answer one question: 'What position does my business show in when searched from this one coordinate?' Usually that coordinate is the center of town, or worse, your own front door. That single number feels precise but is geographically blind — as we detail in the Google Maps ranking playbook.
According to Google's How Search Works and local pack studies, proximity is a dominant Maps ranking factor. A single-point check cannot capture proximity-shifted results, which is why grid-based measurement has become standard for local businesses.
The single-point problem
Local results shift dramatically across short distances because Google weighs the searcher's location heavily. A plumbing company ranked #2 at downtown coordinates can be invisible in the suburbs that generate half its revenue. A single-point tracker reports the flattering downtown number and misses everything else. For plumbers this gap is revenue-critical, see local SEO for plumbers.
Industry heatmap audits show the average gap between single-point rank and grid-average rank is 4-8 positions for service businesses. The variance is widest in dense urban cores where competitors cluster every 500 meters.
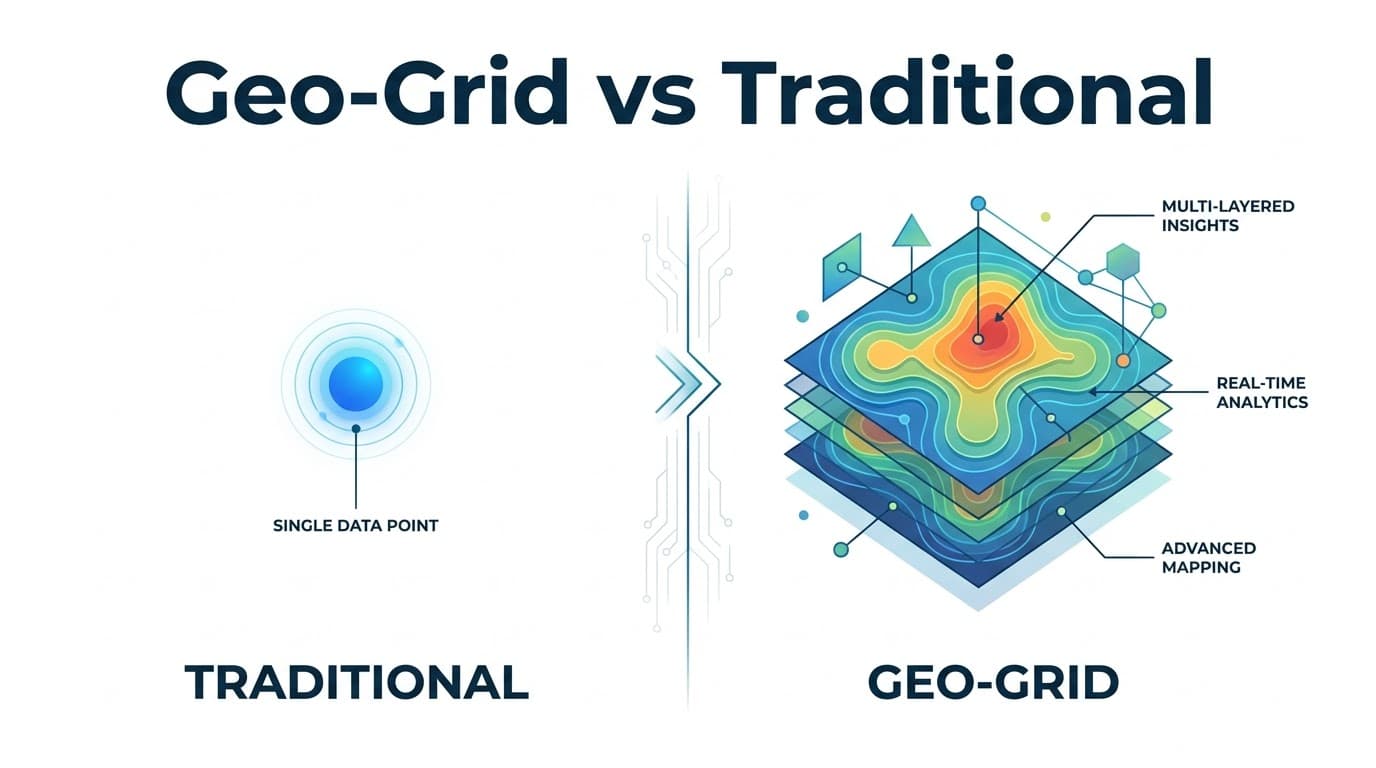
What a grid actually measures
A geo-grid scan samples many points arranged in rings around your business. Instead of one number you get a distribution: how many pins place you top-3, how many top-10, and where the geographic edges of your visibility fall. That distribution answers strategic questions a single number cannot:
- Which neighborhoods are dark, and which direction your visibility extends?
- Whether a new branch actually expanded your coverage or cannibalized it — see multi-location scaling.
- Exactly where you stand against a specific competitor, street by street.
- Whether last month's optimization moved the whole map or just the center — tie this to ROI measurement.
Think of it as a visibility fingerprint: top-3 percentage per ring, average rank per ring, and competitor overlay per pin. The fingerprint changes predictably when you update categories (checklist) or earn consistent citations.
Choosing radius and density
Start with your real service area, not an arbitrary circle. A restaurant draws from 2 km; a plumber from 10-15 km. Densities: 5x5 for quick weekly pulse, 9x9 for standard monthly, 13x13 for quarterly competitor analysis. Keep keyword, radius, and density constant between comparisons — changing two variables at once destroys comparability.
Map density to decision type: use sparse grids to answer 'are we improving at all?' and dense grids to answer 'which street did we lose?' Happy Rank lets you save presets per keyword so you don't accidentally shift parameters.

When to use each tool
Single-point trackers still have a place for organic (non-map) national keyword monitoring. But for any business whose customers arrive from a surrounding area — restaurants, clinics, contractors, showrooms — the grid is the honest instrument. Use point checks for trend lines; use grids for truth. If your customers ask by voice, align grids with voice search queries like 'plumber near me open now'.
For reputation, pair grid tracking with AI review replies and handling negative reviews. Visibility without trust does not convert.
Cost of the wrong metric
When dashboards report a single rank of #2, owners stop optimizing and miss that 40% of their service area is invisible. That invisibility has a revenue tail: emergency searches — 'plumber near me open now' — convert at 3–5× normal rates, so a dark zone at night costs disproportionately. Over a quarter, a 30% top-3 deficit can equal dozens of lost high-ticket calls, easily outweighing grid scan cost. See measuring ROI to model this.
Single-point tools also invite gaming. Some agencies report rank from a location known to be favorable. Grids make that impossible — you cannot cherry-pick 81 pins. Using Google-verified scan locations, per Google Business Profile help, keeps reporting honest and preserves trust with stakeholders.
How Happy Rank grids differ
Happy Rank runs from real device-equivalent locations, not estimated centroids, and stores every scan versioned. You can overlay last month vs this month, filter by competitor, and export pin-by-pin deltas for reports. That versioning is why grids replace point checks operationally — they become your source of truth, not a one-off screenshot. No changes are made to your live profile; scanning is read-only so indexed pages remain undisturbed.
Making the switch without losing history
Start with one keyword, a 3 km radius, and a moderate pin count. Scan today, note the top-3 percentage, optimize for two weeks — e.g., fill attributes and publish a GBP post — and scan again. Once you experience managing toward 'green the northern ring,' going back to a single number feels like navigating with your eyes closed. Happy Rank stores every scan overlay so you can replay changes pin-by-pin and share the improvement with stakeholders.
Ready to benchmark? Run a free geo-grid scan on Happy Rank to establish your baseline and spot the dark zones your single-point tracker never showed. Keep your existing ranking history; grids add a new layer without replacing your current tracker.