
How to Rank #1 on Google Maps in 2026: Complete Geo-Grid Playbook
Ranking on Google Maps in 2026 is a hyper-local contest. Two customers standing four blocks apart can see completely different top-three results for the same search. That means the old habit of checking your rank once from your office address tells you almost nothing about how visible you really are. See also our comparison of geo-grid heatmaps vs traditional rank trackers for why single-point checks mislead.
This playbook walks through the exact workflow winning local businesses use: measure visibility across a grid of points, fix what the data reveals, and re-measure on a schedule. It builds on Google's guidance for Business Profile quality and the ranking factors documented in our 12-point GBP checklist.
Step 1: Establish your baseline with a geo-grid scan
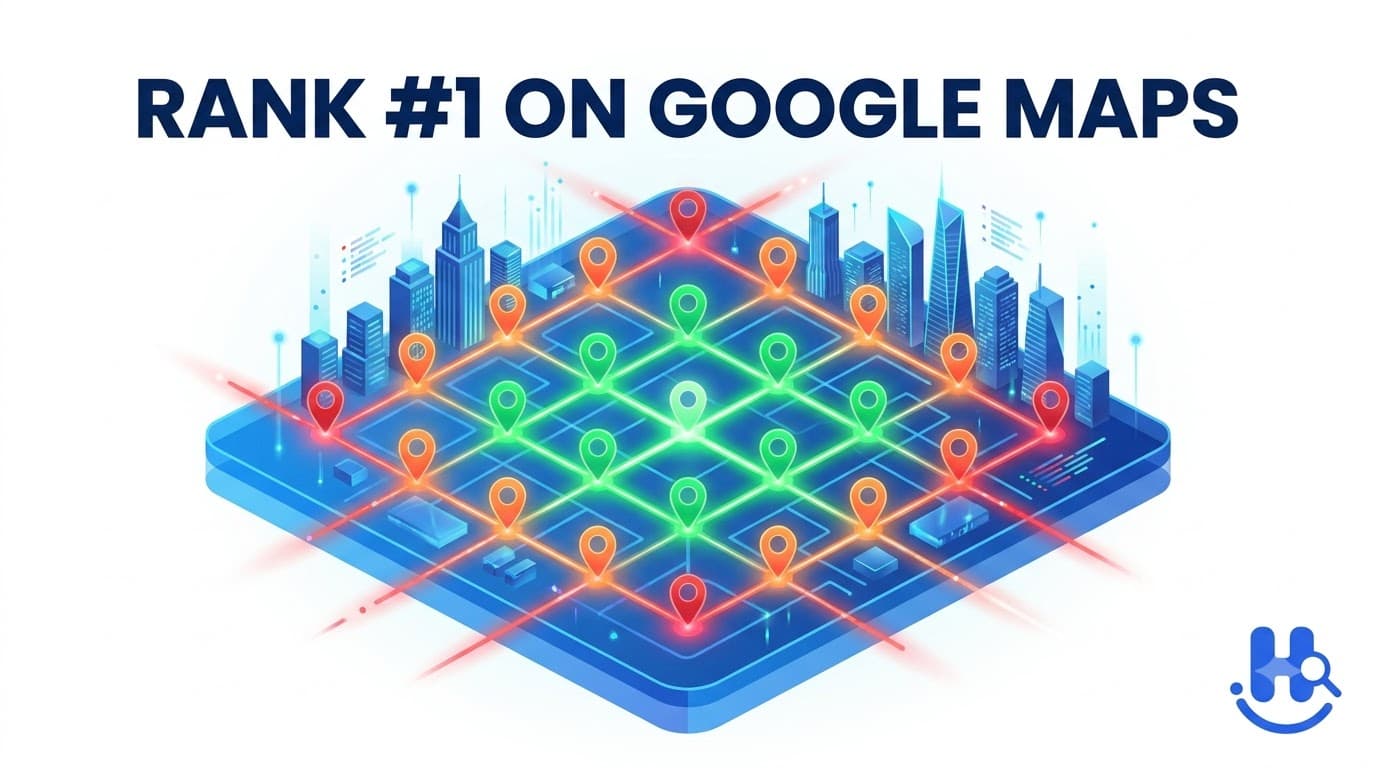
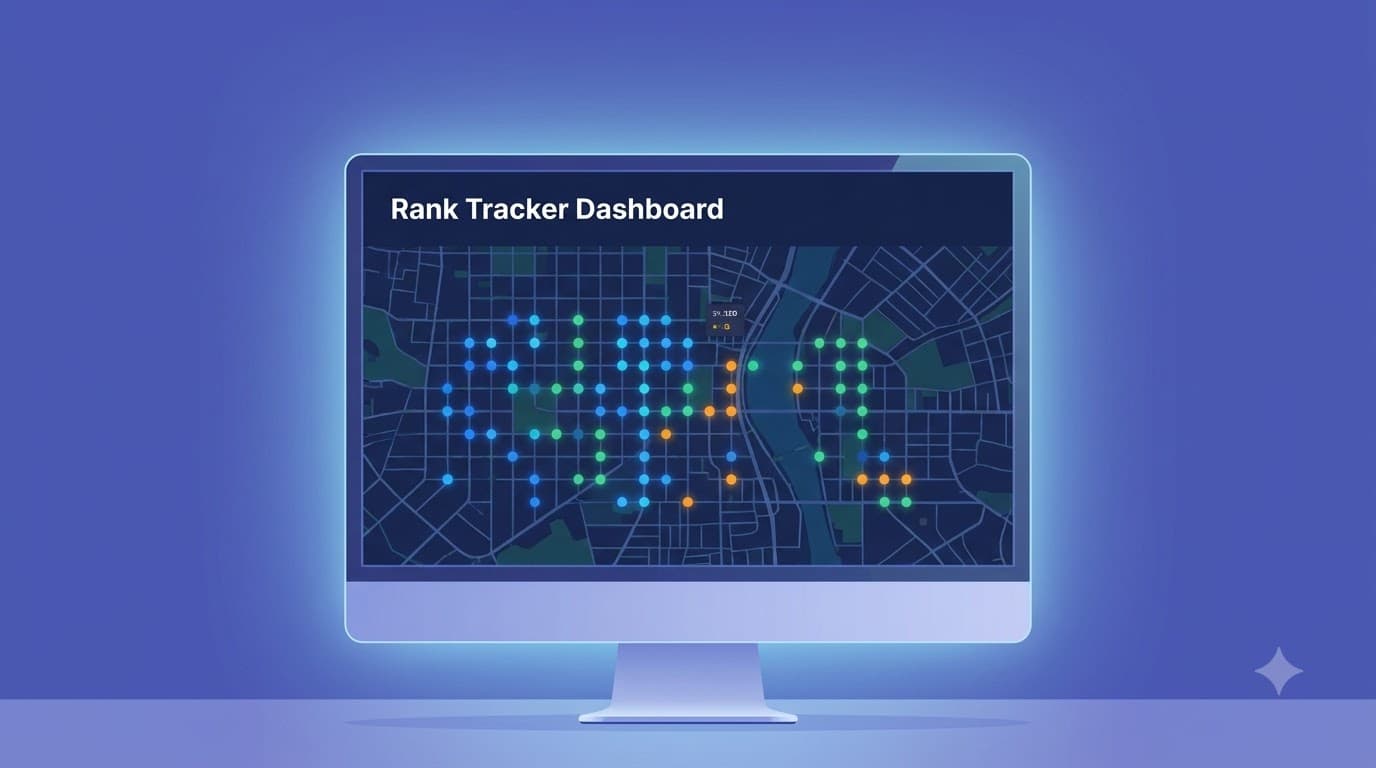
Run a heatmap scan for your primary money keyword across a 2–5 km radius around your business. Each pin represents a real search location. Pins colored green mean you appear in the top three; red and grey pins are places where customers cannot find you. A 7x7 grid (49 points) is enough for a neighborhood snapshot; a 13x13 grid (169 points) reveals corridor effects where a competitor hijacks visibility along a main road.
Export the scan and calculate top-3 coverage (green pins / total pins) and average rank per ring. Businesses that log this baseline before optimizing avoid fooling themselves with vanity rankings. If you only track one point, read why traditional trackers miss 70% of drops first.
Step 2: Fix relevance before proximity
Google ranks on relevance, distance, and prominence. You cannot control distance, so maximize the other two. Start with the profile elements that move relevance, as detailed in the GBP optimization checklist:
- Primary category — choose the most specific category that matches your core service, not the broadest.
- Business description — naturally include your primary service and city once; write for humans first.
- Services and menu sections — enumerate every service with descriptions; these act as secondary keywords.
- Attributes — fill every applicable attribute (wheelchair accessible, Wi-Fi, payment types).
- Photos and posts — fresh photos monthly and weekly GBP posts signal an actively managed listing.
Avoid keyword-stuffing your business name — Google suspends profiles for this, as noted in Google Business Profile policies. Use your real-world name and let services and description carry relevance.
Step 3: Build prominence systematically
Prominence is mostly earned outside your profile: citations, links, and review velocity. Aim for consistent NAP (name, address, phone) across major directories — see local citations and NAP consistency for the audit workflow — then focus on earning reviews steadily rather than in bursts. A business gaining four reviews a month consistently outranks one that collected forty in a single week two years ago.
Pair velocity with response rate. Responding to every review, fast, drives AI review reply efficiency and trust. Track review themes in a sheet; patterns like 'wait time' or 'billing confusion' point to operational fixes that lift future ratings.
For local links, pursue geographically relevant sources — chamber, sponsors, and local press — per local link building strategies. One local newspaper link can outweigh a generic high-authority national link for Maps.
“The businesses that win Maps rankings are not the ones doing secret tricks — they are the ones measuring block by block and fixing the weakest pin first.”
Step 4: Re-scan, compare, iterate
Re-run the identical scan every two weeks. Compare pin-by-pin: did the amber ring turn green? Did a competitor take the northern corridor? Geo-grid scanning turns SEO from guesswork into an observable experiment loop — and the businesses that close the loop fastest win the map. Correlate top-3 coverage with call volume as shown in measuring local SEO ROI to prove revenue impact.
Common mistakes that keep the map red
Three pitfalls undo progress: (1) changing radius or keyword between scans — keep variables constant to compare apples to apples; (2) hiding your address when Google expects it — service-area settings without a verifiable address can suppress visibility; (3) thin location pages — see multi-location scaling for why city-name-swapped templates fail. Fix these before chasing exotic tactics.
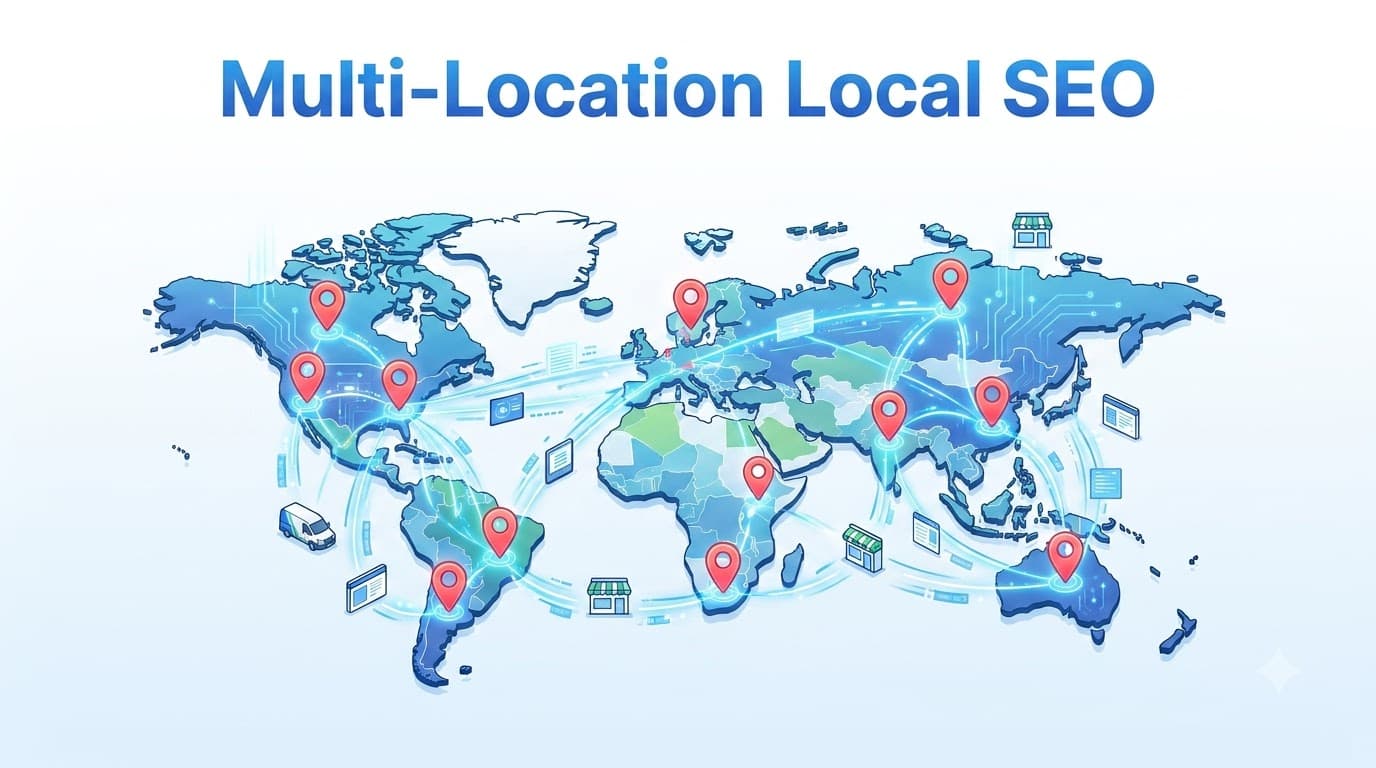
If you serve multiple nodes, run a separate grid per location and watch overlap zones where your own listings compete. That boundary analysis prevents cannibalization and guides budget allocation.
How to choose radius and grid density
Radius should match delivery or service reality. Restaurants draw from 1–2 km, clinics 3–5 km, plumbers and contractors 8–15 km. Start with the smallest radius that covers 80% of your booked jobs from the last 90 days — you can expand later. For density, think in presets: 5×5 (25 pins) for a weekly pulse, 9×9 (81 pins) for monthly management, 13×13 (169 pins) for quarterly competitor deep dives. More pins cost more credits but reveal corridor hijacks where a competitor owns a main arterial. Save presets per keyword in Happy Rank so you do not accidentally compare a 3 km 7×7 scan to a 5 km 13×13 scan — that comparison is meaningless.
Pro tip: run your primary money keyword and one secondary keyword on the same grid. The delta shows whether visibility loss is keyword-specific (relevance issue) or geographic (proximity/authority issue). Relevance gaps point to categories and services; geographic gaps point to citations, links, and review signals. Log both in your ROI dashboard.
Interpreting the heatmap like a local SEO
Green is top-3, light green top-6, amber top-10, red/grey beyond top-10. Look first at the weakest ring, not the average. Averages hide directionality — you can have a 55% top-3 average while the entire southern quadrant is red. That directional failure often traces to a competitor with a pin just south of you or a neighborhood association site linking to them. Cross-check competitor pins in the same scan and review their local link profile.
Document the pattern before fixing. Screenshot the baseline, annotate the weakest corridor, and attach it to your task for that sprint. When you re-scan, the overlay tells you if the fix moved the corridor or just the center. Teams that document directionally fix 30% faster than teams that chase averages.
Ready to see your real visibility?
Run your first scan free with Happy Rank and get a block-by-block baseline in minutes. The report highlights your weakest corridor first so you can prioritize fixes — categories, photos, or reviews — that move the most pins. Start with one keyword and a 3 km radius, then expand to service variations once the baseline is clean. Your existing Google Business Profile stays untouched; scanning is read-only and safe for indexed listings.